Debugging Part 2
One of the most important and useful tools for debugging are the Chrome Dev Tools(or the equivolent on other browsers). The tabs we will use most frequently for debugging are:
- Console
- to see our console logs
- to see any errors that may show up
- Sources
- to check our file connections (are the styles.css and app.js files properly connected to our HTML)
- to check whether our JS is working as expected
- Network
- to check http requests and connections with the server
In this artice we are going to focus on the Sources and Console Tabs.
Console
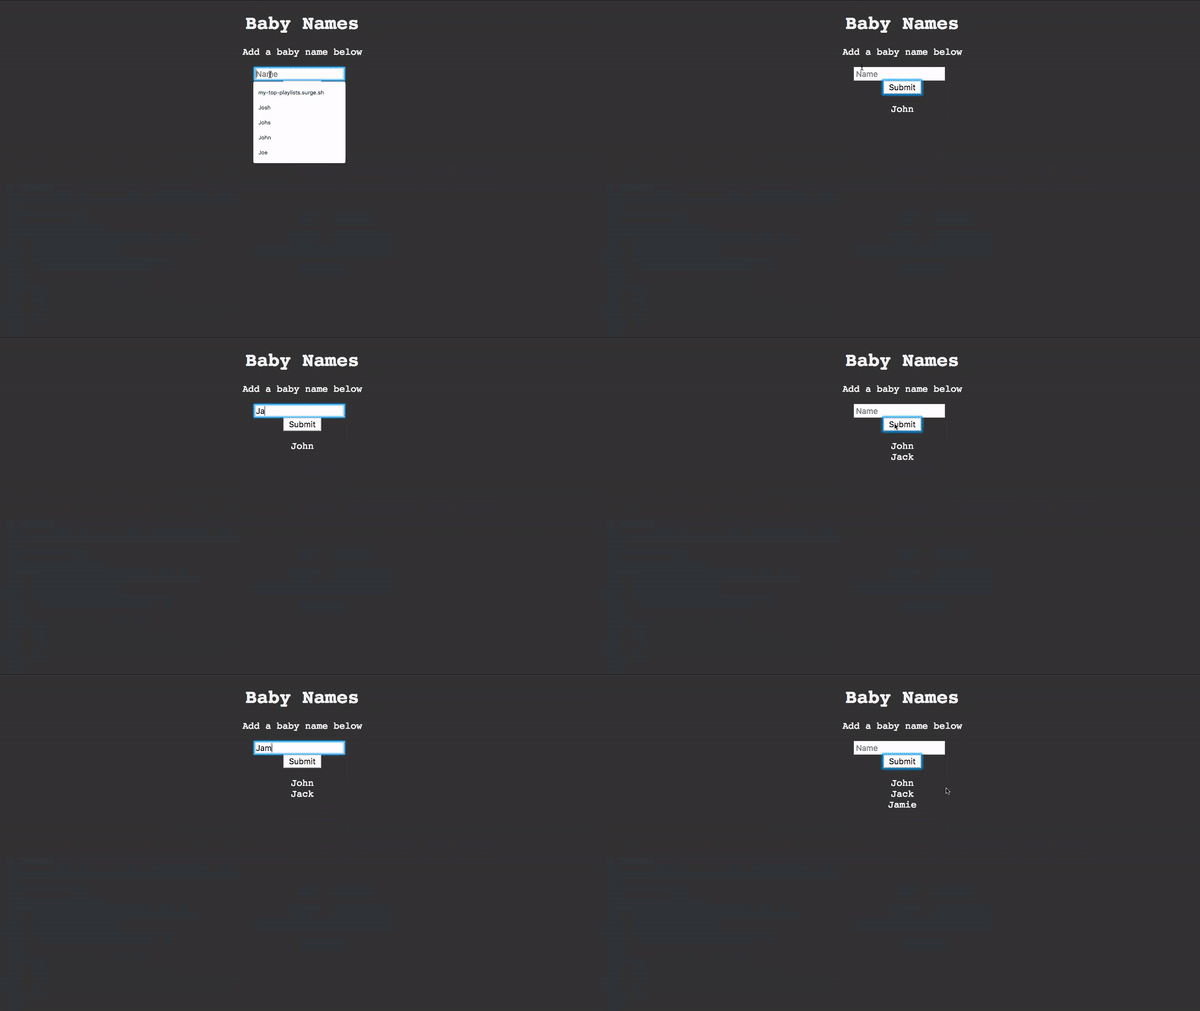
The console is extremely helpful and should be the first thing you check when something isnt working correctly. I made an app that will all you to make a list of baby names. It looks like this:

Here is the code
index.html
<!DOCTYPE html>
<html lang="en">
<head>
    <meta charset="UTF-8">
    <title>Travel Form</title>
    <link rel="stylesheet" href="styles.css">
</head>
<body>
    <div id="container">
        <h1>Baby Names</h1>
        <p>Add a baby name below</p>
        <form id="myForm">
            <input type="text" name="name" placeholder="Name">
            <br>
            <button type="button" id="submit">Submit</button>
        </form>

        <ul id="babyNames"></ul>
    </div>

    <script src="app.js"></script>
</body>
</html>
app.js
var form = document.getElementById("myForm");
var submit = document.getElementById('submit');
var nameList = document.getElementById('babyNames');

var names = [];

function addName(e) {
    var name = form.elements["name"].value;
    myName.push(name);
    displayNames(name)
    form.elements["name"].value = '';
}

function displayNames (list) {
    nameList.innerHTML = '';
    for (i = 0; i < list.length; i++){
        nameList.innerHTML += `<li>${list[i]}</li>`
    }
}


submit.onclick = addName;
There is, however, a problem with this website. When I click submit, nothing happens.
We could try and scan through the code and catch the error by eye, but that could take a tremendous amount of time especially when you are working with someone elses code. A much more efficient way is by simply opening up our console.

Cool! There are two things you should pay attention to on this error.
- The first line
Uncaught ReferenceError: myName is not defined app.js:9on the far right of the screen
The first line explains what type of error it is and even names the variable that is causing the issue.
If we click on the app.js:9 it will take us over to the sources tab to a page that looks like this:
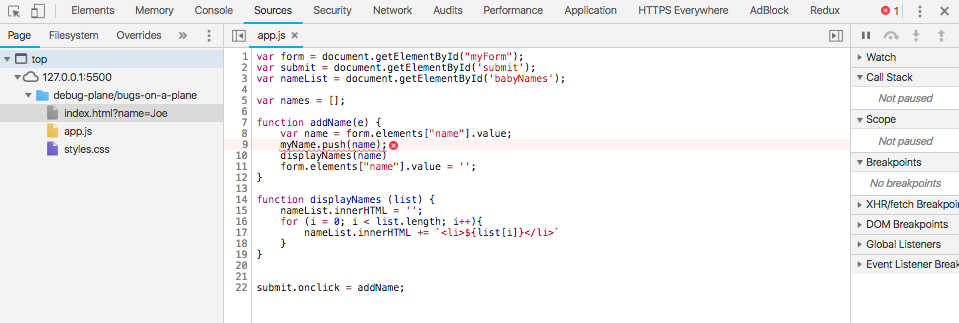
We can now see that we misnamed the array and can simply change myName back to names which should resolve that error.
Sources
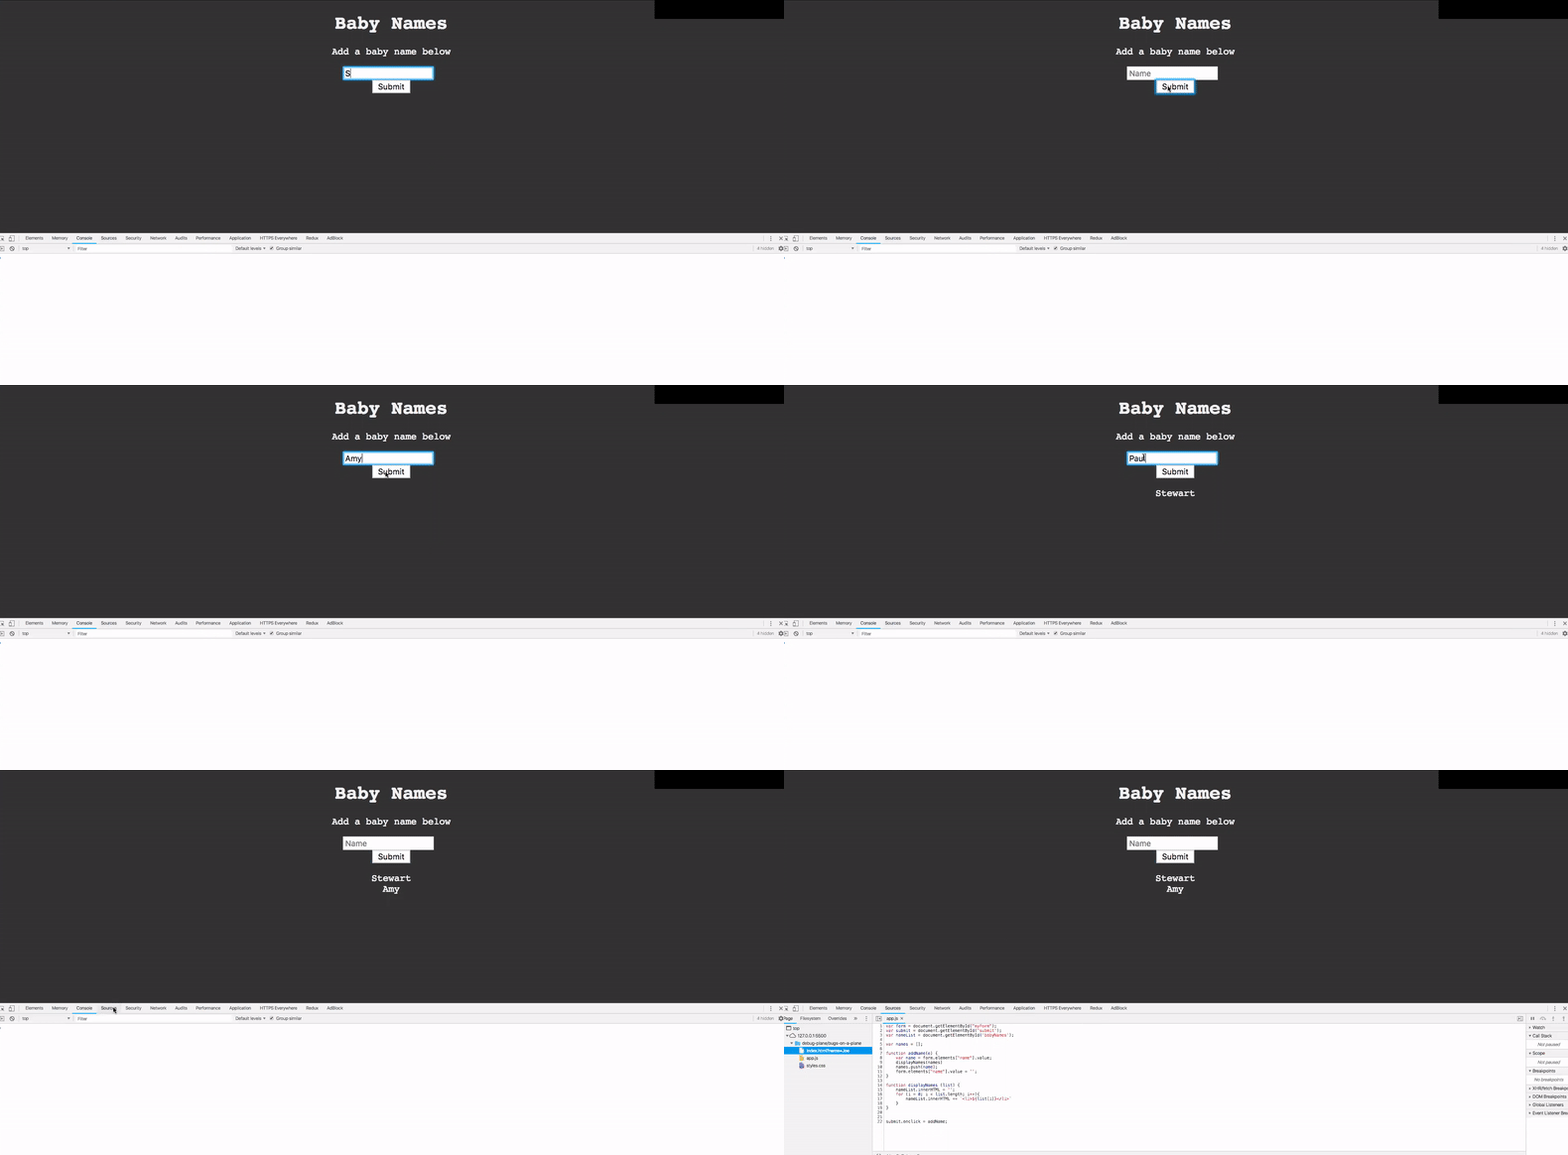
Now that we fixed that error we have another problem. If you watch the gif below you will see that now when we add a name it doesn't show up until another has been added. You may also note that there are no errors showing up.
This is where the sources tab really comes in handy. First we will add a few breakpoints.
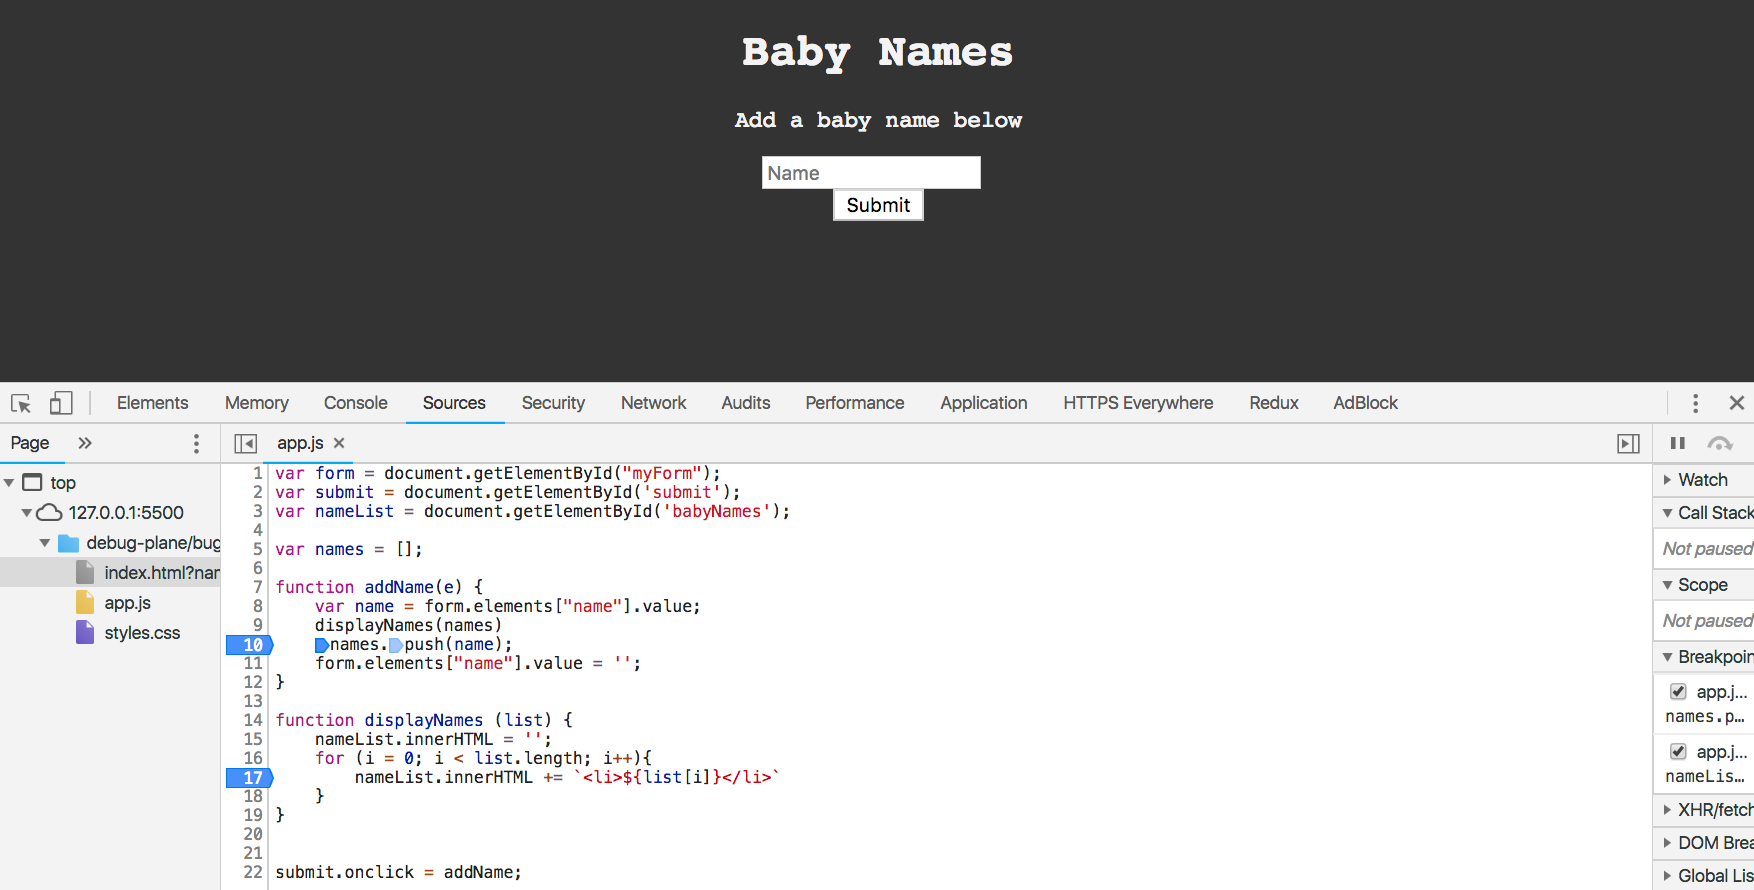
You add breakpoints by simply clicking the number where you want the breakpoint to be. Let's see what happens when we put a name in and press submit.

You will see that the code will stop at each breakpoint as it gets hit. It will also show what their values are up to that point if you hover over them. Using breakpoints in our sources tab we are able to see that it is pushing the name after we display it, so it doesn't show up until the next time through. We simply need to place the displayNames(names) after the names.push(name) rather than having it before it.
Now our page will work as expected.
Let's take a look at some different code now
index.html
<!DOCTYPE html>
<html lang="en">
<head>
    <title>Cars</title>
</head>
<body>
    <h1 class="words">My Cool Car</h1>
    <img src="https://images.unsplash.com/photo-1532988633349-d3dfb28ee834?ixlib=rb-0.3.5&ixid=eyJhcHBfaWQiOjEyMDd9&s=27db7bd25fb02721c56f744d6bce008c&auto=format&fit=crop&w=500&q=60" alt="">
    <p class="words">Red Porsche</p>
</body>
</html>
styles.css
body {
    background-color: black;
}

img {
    display: block;
    margin: auto;
    width: 300px;
}

.words {
    font-family: monospace;
    color: #f3f3f3;
    text-align: center;
}
If we go to the page it looks like this
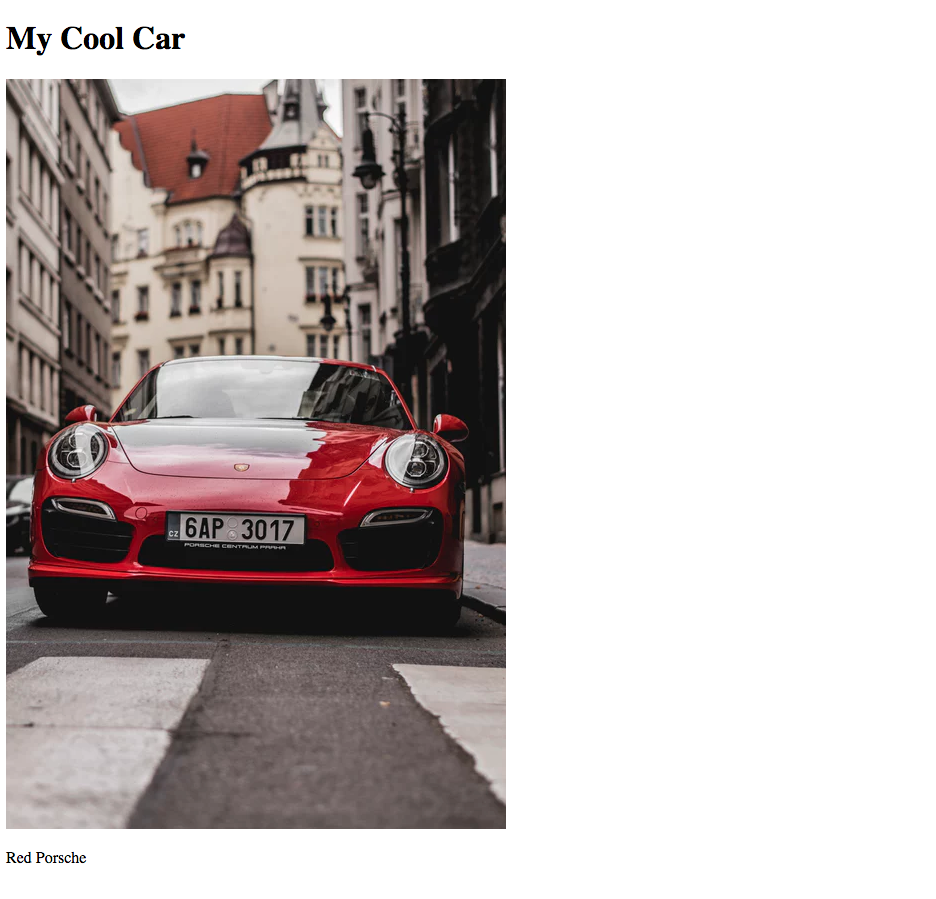
So why aren't our styles showing up even though we have them all written out correctly?
Let's look at our sources tab

Notice that on the left side it only shows us an index.html but not a styles.css. This means that we have not properly connected our stylesheet.
If we go look at the HTML above we will see that it is missing a line
<link rel="stylesheet" href="styles.css">
Let's add that in and see what changes
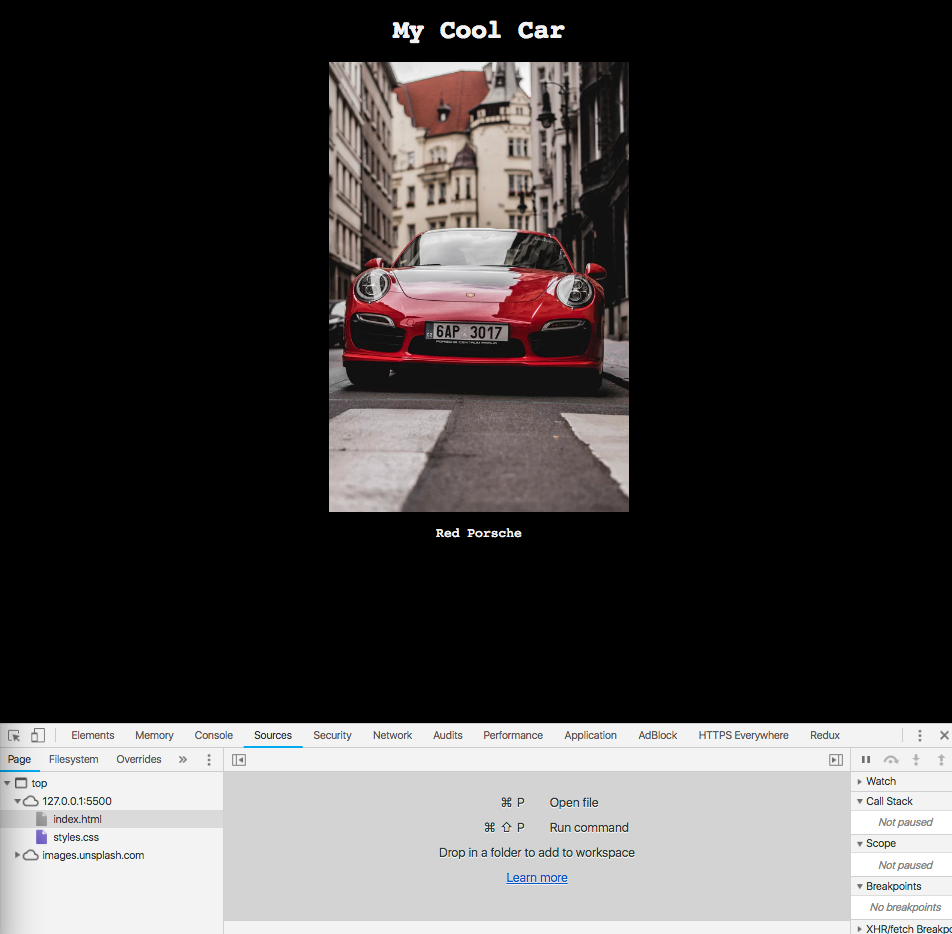
You will notice that now our page is styled and if you look in our sources tab, now there is a styles.css file listed below our index.html. When you add in a JS file or any other file type it will show up in that same location.
Now go practice these techniques in the Bugs on a Plane debugging exercise

