Building a Bar Chart - HTML, Vanilla JS, D3

We are going to teach you how to build a basic bar chart in this write-up 3 ways.
- Statically,
- Using only HTML
- Dynamically,
- Using Vanilla JS
- Using D3
HTML
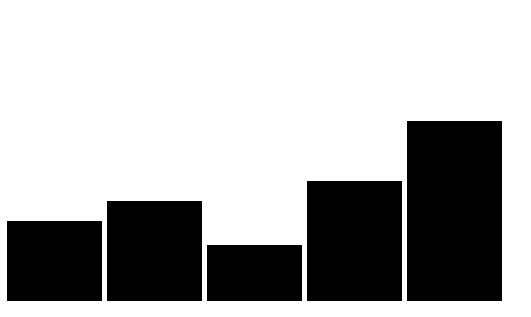
First, let's look below at the code of a completed Bar Chart.
<!DOCTYPE html>
<html lang="en">
    <head>
        <title>Bar Chart HTML</title>
    </head>
    <body>


       <svg width="500" height="300">
           <rect y="220" height="80" width="95" transform="translate(0,0)" ></rect>
           <rect y="200" height="100" width="95" transform="translate(100,0)" ></rect>
           <rect y="244" height="56" width="95" transform="translate(200,0)" ></rect>
           <rect y="180" height="120" width="95" transform="translate(300,0)" ></rect>
           <rect y="120" height="180" width="95" transform="translate(400,0)" ></rect>
       </svg>

    </body>
</html>
Now we will break it down and understand just exactly what is going on here.
SVG
SVG stands for Scalable Vector Graphics
SVG is used to define graphics for the Web
SVG has several methods for drawing paths, boxes, circles, text, and graphic images.
Basically, an <svg> is a container for the following shapes/graphics:
<rect><circle><polygon>- several others
The svg tag has two attributes that you will use whenever you create an svg container.
- height
- width
These are setting the size of the container.
<body>

       <svg width="500" height="300"></svg>

</body>
rect
Since we are creating a bar chart, we are going to next use the rect tag to create the individual bars inside our svg.
The rect accepts a variety of attributes, but for our need we will only be using the following:
- y
- height
- width
- transform
I will now go over what each of these does.
y - Defines the top position of the rectangle. ex: y='0' would put the rectangle at the top of the svg container.
height - Defines how tall the rectangle will be.
width - Defines how wide the rectangle will be.
transform - The transform property applies a 2D or 3D transformation to an element. For our situation we will be using translate(x,y) for transform.
- translate(x,y) - Defines a 2D translation. ex: If we did translate(300, 0) it would move the rectangle 300px from the left and 0 px from the top.
Now that we understand WHAT everything is doing, let's see it all in action.
    <body>

       <svg width="500" height="300">
           <rect y="220" height="80" width="95" transform="translate(0,0)" ></rect>
       </svg>

    </body>
This would add in a rectangle

Let's we add in a few more
<body>

       <svg width="500" height="300">
           <rect y="220" height="80" width="95" transform="translate(0,0)" ></rect>
           <rect y="200" height="100" width="95" transform="translate(100,0)" ></rect>
           <rect y="244" height="56" width="95" transform="translate(200,0)" ></rect>
           <rect y="180" height="120" width="95" transform="translate(300,0)" ></rect>
           <rect y="120" height="180" width="95" transform="translate(400,0)" ></rect>
       </svg>

</body>

AMAZING!
Now let's show you what this would look like in Vanilla JS.
<!DOCTYPE html>
<html lang="en">
    <head>
        <title>Bar Chart JS</title>
    </head>
    <body>

       <svg id="bar-js"></svg>

        <script src="index.js"></script>
    </body>
</html>
index.html
var dataset = [80, 100, 56, 72, 85];

var svgWidth = 500, svgHeight = 300, barPadding = 5;
var barWidth = (svgWidth / dataset.length);

var svg = document.getElementById('bar-js');
svg.setAttribute("width", svgWidth);
svg.setAttribute("height", svgHeight);


for(var i = 0; i < dataset.length; i++){
    var rect = document.createElementNS("http://www.w3.org/2000/svg", 'rect');
    rect.setAttribute("y", svgHeight - dataset[i])
    rect.setAttribute("height", dataset[i])
    rect.setAttribute("width", barWidth-barPadding)
    var translate = [barWidth * i, 0]
    rect.setAttribute("transform", "translate("+ translate +")")
    svg.appendChild(rect)
}
index.js

The main difference to notice here is that the bars are being sized based on the var dataset we give above.
Let's see what happens when we add 2 more numbers to that array.
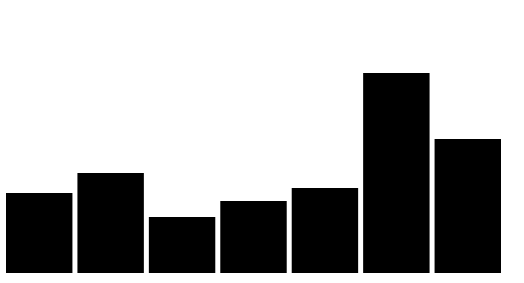
var dataset = [80, 100, 56, 72, 85, 200, 134]

Now our bar chart is dynamic!!
Here is what it would look like if you did it in D3
<!DOCTYPE html>
<html lang="en">
    <head>
        <title>Bar Chart JS</title>
    </head>
    <body>

       <svg id="bar-js"></svg>

        <script src="https://d3js.org/d3.v4.min.js"></script>
        <script src="index.js"></script>
    </body>
</html>
index.html
var dataset = [80, 100, 56, 72, 85, 200, 134];

var svgWidth = 500, svgHeight = 300, barPadding = 5;
var barWidth = (svgWidth / dataset.length);

var svg = d3.select('svg')
   .attr("width", svgWidth)
   .attr("height", svgHeight);

var barChart = svg.selectAll("rect")
   .data(dataset)
   .enter()
   .append("rect")
   .attr("y", function(d) {
        return svgHeight - d
   })
   .attr("height", function(d) {
       return d;
   })
   .attr("width", barWidth - barPadding)
   .attr("transform", function (d, i) {
       var translate = [barWidth * i, 0];
       return "translate("+ translate +")";
   });
index.js
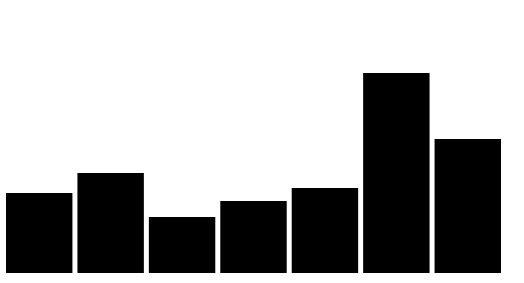
Which would produce the same result as the Vanilla JS code.

If you do not understand what is happening in the D3 section, you can refer to our write up of D3 here.
The code is pretty straightforward if you read through it, ask your instructors or use google to figure out anything that may not be clear.

